The addition of substantial quantities of new information will not in and of itself establish EMLO as the definitive aggregation point for epistolary metadata. Rather, if the resource is to fulfil its potential and meet the requirements of a new generation of users and potential contributors, we must transition simultaneously from a union catalogue to a tool of research and analysis by delivering services for the navigation, analysis, comparison, and visualization of the material assembled. Informed by two scholarly Pilot Projects, and guided by a Digital Humanities Postdoctoral Fellow, an intensive programme of software engineering will pursue these goals.
Under the Hood: Revising the Data Model
A first step, to be completed in 2013, will be to revisit our original data model, agreed back in 2009, and give it a thorough overhaul by creating new objects, new relationships, and new structured vocabularies. In particular, each item in the catalogue will no longer be treated as a static construct but as a dynamic, time-sensitive entity characterized by specific events at various points in its history. In technical terms, these revisions — consisting largely of the introduction of new relationships within the upgraded POSTGRESQL environment of EMLO-Edit — will incorporate elements of a common semantic model of key contextual entities (people, organizations, times, and places) currently emerging. Thus, while correspondence will remain front and centre, it will be contextualized by much more granular, relational handling of the following key constituents of the Republic of Letters:

People
Biography and prosopography will be a special focus: our object model for people will be expanded to include occupations and nationalities; relationships with others (further divided into familial relationships, personal relationships, and professional relationships); and relationships to places. Contributors of data to the catalogue will also feature much more prominently.
Places
Our approach to places will become more historicized, with spatial entities reconceived as a series of time-coded part-to-whole relationships (e.g. ‘Banbury’ would be identified as a smaller sub-set of ‘Oxfordshire’ within the national unit of ‘England’), and tied more closely to the movements of correspondents, as well as to the origins and destinations of their letters.
Books & Objects
Those publications and objects which were so often mentioned in letters – and travelled with them in the context of enclosures – will benefit from a much more granular treatment.
This approach will provide the standardization and segmentation necessary for efficient searching and analysis with the flexibility necessary to accommodate information of any level of simplicity or complexity, generality or detail. Once populated by the work of the two scholarly postdocs, the result will be an important new prosopography of the key correspondents of Hartlib and Comenius; an exciting new gazetteer of the historical place names found within the Hartlib material; and a granulated, chronological index of books and objects which — while in no way definitive at this stage — will provide crucial bibliographical and material context for the existing contents of EMLO.
Kerb Appeal: Browsing, Searching, Analysing, Visualizing
New possibilities for data capture and linking ‘below the bonnet’ in EMLO-Edit will allow for exciting new ways of expressing and manipulating catalogue content – focusing in the first instance on the correspondence networks of Hartlib and Comenius – in the search and discovery interface. These work packages will take place largely in 2014.
Browsing & Searching
Our new data structures will be made discoverable and manageable within the existing front end (implemented in Python/Pylons with search provided by Apache SOLR). This means new search forms, a restructuring of existing forms, updated filtering and faceting, updated browse lists, and – most excitingly – a reconfiguration of profile pages for letters, people, publications, and objects as dynamic, aggregated, configurable streams in which personal and intellectual events – letters sent and received, books and pamphlets written, rites of passage, professional associations, and so on – are seamlessly intertwined. For example, this Hartlibian person profile will be reconceived as something like the following, with underlined items indicating links to the relevant entity (which would also, in turn, be presented in streamed format):
Schlezer, Johann Friedrich
- 1596 – Born in Mecklenberg
- 1626 – Matriculated at the University of Rostock
- 1629 – Matriculated at the University of Leiden
- 1637 – Active in Amsterdam; Mentioned in 1 Letter
- 1640 – Mentioned in 2 Letters
- 1642 – Employed by the Brandenburg Court
- 1643 – Active in The Hague
- 1646 – Active in Osnabruck as a Diplomat; Active in Dusseldorf as a Diplomat with Konrad von Buggsdorf
- 1647 – Sent 1 Letter
- 1654 – Active in London; Sent 6 Letters.
Such enhancements, however, are insufficient. As the volume of catalogue content grows, and as the information captured on the networks of Hartlib and Comenius in the context of the Pilot Projects (and, in turn, other correspondences) becomes increasingly sophisticated, it will become ever-more difficult to navigate and comprehend the EMLO ecosystem via web forms, lists of links, and other textual devices. For this reason, a complete set of scholarly tools for dealing with, and way-finding within, large-scale epistolary metadata must include the ability to render it visually.
Analyzing & Visualizing
Thus, a second major focus for 2014 – to be spearheaded in particular by the Digital Humanities Postdoc working in conjunction with our Front End Developers – will be to develop and integrate a suite of in-browser visualization applications for analyzing, charting, mapping, and even animating the metadata we have assembled. Rather than relying on the development of new frameworks or proprietary applications, the visualizations will be crafted using exclusively open source packages such as ProtoVis, Gephi, Sci2, and other non-proprietary platforms; see Scott Weingart talking about these at our 2011 Visualization Workshop, or this useful list. Three main species of data viz are envisaged:

Charts & Graphs
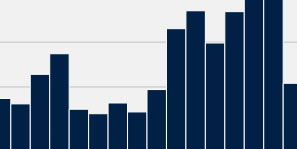
It’s not all shock and awe; at the most basic (and arguably the most useful) level, we will be adding a larger number of graphs to all profile pages and results lists, to supplement the basic bar charts already provided on person profiles (e.g. pie charts breaking down main correspondents, most common locations, sparklines displaying the distribution of results over time, and so on).
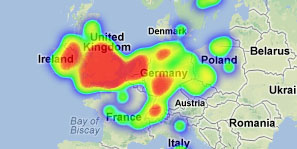
Maps
Next on the agenda are a variety of cartographic visualizations. Letters are indexes of intellectual activity which are precisely locatable in time and space. The most basic function of the spatial toolset would be to map the location from and to which individual letters are sent, to aggregate such data into a map of entire correspondence networks, and to show the evolution of those networks in time as well as space. These maps will also chart the movement of individual correspondents as well as the correspondence they sent and received as they peregrinated.
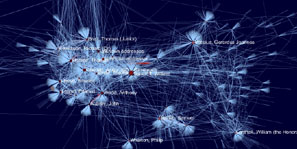
Network Diagrams
Another key aim is to generate efficiently the kind of schematic, prosopographical network visualizations based on frequency of correspondence and kinds of connection rather than geographical distance (e.g. the great example here). For example, in order to locate key nodal individuals and clusters within the Republic of Letters, users should be able to map any number of selected correspondences to see how, where, and when they intersect.